Best Cities for Low-Income Housing
With economic security still out of reach for a growing number of working families in the U.S., many households rely on low-income, subsidized housing programs to make ends meet. Formed in 1965, the U.S. Department of Housing and Urban Development (HUD) aims to tackle the needs for low-income households while creating sustainable, inclusive communities and quality, affordable homes for those in need. Though there are over 3,500 Public Housing Authorities (PHAs) in the U.S. that govern low-income housing for a city or region, not all are created equal. Rent To Own Labs decided to take a deeper dive to analyze and highlight the U.S. cities that provide the most housing opportunities for households in need.
The public programs that provide affordable housing help foster self sufficiency & stability for low income families, helping provide safer & more sustainable communities around the country, and ultimately providing a higher quality of life for these families & those in their community.

Over time, housing has become less and less affordable relative to income. This has made it increasingly difficult for low income families to balance their budgets & build for a better future when they're also trying to juggle other everyday expenses like transportation, healthcare, groceries, and clothing.
At the same time, the average U.S. household has over $135,000 in debt as of 2016. As Americans struggle to get ahead, it's important to recognize which local communities are doing the best job at aiding low income families & providing them with affordable housing opportunities, while also pointing our which ones have the biggest room for improvement.
RTOL’s Analysis
What makes a city “good” for low-income housing? To determine the effectiveness of a specific city’s housing program, Rent To Own Labs examined the most recent PHA and American Community Survey data from the U.S. Census Bureau found from HUD.
Rent To Own Labs calculated a low-income housing accessibility ratio by taking the total number of public housing units in cities with over 5,000 low-income households, and dividing that number by the total eligible low-income households. This ensures that the data can be comparable, while also removing any outliers with a low number of eligible households.
The total number of public housing units includes those provided by both the PHA low-rent program and Section 8 program. The “number of households” is the number of households whose income are lower than the 80% of the local median income level, as defined by HUD.
Data Source
The data source for the number of public housing units is from the Public Housing Authority dataset provided by the U.S Department of Housing and Urban Development.
There are about 3,500 public housing authorities (PHAs) in U.S. However, in our study, 665 PHAs are considered. The main reasons for the exclusion of some PHAs are: 1) some PHAs are at the county or regional level rather than city level; 2) there is no information on the number of low-income households for that city; 3) they did not meet our requirement of at least 5,000 low income households.
The data source for the number of eligible low-income households is from ACS 5 Year CHAS Data by Place as of 2012 dataset provided by the U.S Department of Housing and Urban Development.
The number of households is the sum of the number of households whose income is less than or equal to 30% of HAMFI, number of household whose income is greater than 30% but less than or equal to 50% of HAMFI, and number of household whose income is greater than 50% but less than or equal to 80% of HAMFI.
Note: The full definition of HAMFI can be found here. It stands for “HUD Area Median Family Income”.
We added the 5,000 lower limit on low income households to prevent small, less wealthy areas from crowding the top of the list. For example, Anthony Texas has a remarkable ratio of 0.869, almost double that of Charleston West Virginia (who is #1 in our list below), but it was much easier for them to do so when having only 550 eligible households. With that said, for the cumulative state-level data, we included these smaller areas.
Note: for the number of public housing units and the number of low-income households for Plymouth, MI comes from its PHA 5-Year and Annual Plan for the year 2009 – 2011.
With that said, here are the top 50 cities for low-income housing:
List of Best Cities for Low Income Housing
10 Pensacola, Florida
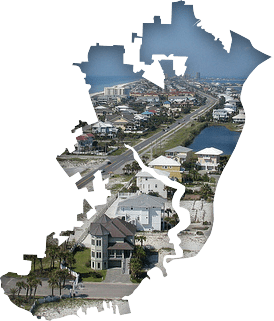
The delightful waterfront city of Pensacola is located in the North of Florida, enchanting many with its relaxing beach and lovely downtown area. Pensacola is a relatively small city with an accessibility ratio of 31.5%, offering 3,048 public units. The city’s housing office works to provide affordable housing to 9,665 low-income households.
9 West Palm Beach, Florida
Being one of the three main cities situated in South Florida, West Palm Beach is a huge attraction with its tropical views, warm climate, and metropolitan magnitude. Its close proximity to Downtown Miami makes it quite prominent and popular. The city’s Housing Authority has worked towards providing 31.8% of low-income households with access. The situation still needs some work, with a number of 21,195 households in need living in the area. However, the city does strive to provide for the community; it also has 6,737 public housing units.
8 Hoboken, New Jersey
Hoboken is city in Hudson County, New Jersey placed on the renowned Hudson Waterfront. The city played a major role in the Port of New York and New Jersey and influences many significant industries. Hoboken has evolved overtime, gathering much history along the way -- going from dilapidated clapboard houses and dingy diners to high-end boutiques and towering condos. It currently has 5,220 low-income households and 1,677 public housing units. 32.15% of those those who qualify have access.
7 Albany, Oregon
The city of Albany brings a cheerful vibe with its farming and manufacturing towns reminiscent of old times. The colorful buildings and bright downtown nightlife is alluring, especially with the city being near the Calapooia and Willamette Rivers. Albany does a fairly fine job of ensuring that 33.7% of low-income households receive the help they need. 7,435 households that qualify currently occupy Albany, which also provides 2,503 public housing units.
6 Spartanburg, South Carolina
Spartanburg is quite the historic little town, with its wonderful skyline, colleges, monuments, and cultural centers. Located in the foothills of the lovely Blue Ridge Mountains, life here is quiet and charming. Its relaxed ambience makes the city quite attractive and surprisingly dynamic. Holding the number 6 spot on our list, Spartanburg offers a 34.1% accessibility ratio and 2,489 pubic units to the 7,295 households in need.
5 Cambridge, Massachusetts
Home to the infamous Harvard University, Cambridge, Massachusetts stands as the 5th best location for low- income households. Lush, verdant expanses of land at the center of a young and hip community keeps Cambridge both picturesque and inviting. Farmers markets, bars, bookstores, cafes, and other little holes in the wall line the streets of beautiful Cambridge. The Housing Authority provides the city’s residents with 35.8% accessible housing opportunities and 5,911 public housing units. 16,500 low-income households call Cambridge home today, meaning there is some work to do, but the city is doing quite well so far.
4 Monroe, Louisiana
Situated in the Northeast section of Louisiana, Monroe is known for its stellar economic, educational, and medical advancements. Its close-knit community makes living in Monroe cozy and comfortable with plenty of activities for the whole family. As it being such a large city, Monroe does a great job of providing housing to its 9,755 low-income households. With 3,622 public housing units and an accessibility ratio of 37.1%, Monroe works hard to adequately accommodates its working class citizens and improve their system.
3 Boston, Massachusetts
As one of the oldest and most populous cities in the United States, Boston, Massachusetts is rich in history and beauty. The historic sites and breathtaking architecture allude to centuries past of America’s founding and growth. It is also a center for higher education and culture, making any moment in Boston truly enriching. With 121,710 low-income households and 46,436 public housing units, Boston impressively extends diverse housing with a ratio of 38.2% to its equally diverse community.
2 Texarkana, Texas
Texarkana, a city in Bowie County, Texas in the Ark-La-Tex region, is home to 5,975 low-income households. Texarkana has 2,598 public housing units and an accessibility ratio of 43.5%. It's twins with a city of the same name in the neighboring state of Arkansas. This quaint location offers an abundance of historical attractions and a laid-back lifestyle.
1 Charleston, West Virginia
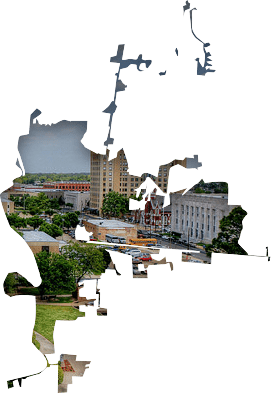
Charleston is the capital of West Virginia, as well the largest city in the state. Located between the Elk and Kanawha Rivers, this city is known as a hub for commerce, industry, and government. Boasting the top spot on our list, Charleston holds 9,210 low-income households and offers 4,158 public housing units. The accessibility ratio comes in at 45.1%, making the metropolitan center of Charleston quite successful in providing adequate housing opportunities.
Table of city results
See below in the table for the data of the top 50 best cities for low income housing.
| City | State | Total # of low income Households |
Total # of Public Housing Units |
Ratio |
|---|---|---|---|---|
| Charleston | WV | 9,210 | 4,158 | 0.451 |
| Texarkana | TX | 5,975 | 2,598 | 0.435 |
| Boston | MA | 121,710 | 46,436 | 0.382 |
| Monroe | LA | 9,755 | 3,622 | 0.371 |
| Cambridge | MA | 16,500 | 5,911 | 0.358 |
| Spartanburg | SC | 7,295 | 2,489 | 0.341 |
| Albany | OR | 7,435 | 2,503 | 0.337 |
| Hoboken | NJ | 5,220 | 1,677 | 0.321 |
| West Palm Beach | FL | 21,195 | 6,737 | 0.318 |
| Pensacola | FL | 9,665 | 3,048 | 0.315 |
| Lorain | OH | 14,940 | 4,521 | 0.303 |
| Greenville | SC | 10,930 | 3,232 | 0.296 |
| Atlanta | GA | 82,280 | 24,002 | 0.292 |
| Lakewood | NJ | 7,760 | 2,191 | 0.282 |
| New Orleans | LA | 72,280 | 20,137 | 0.279 |
| Florence | SC | 5,545 | 1,525 | 0.275 |
| Port Arthur | TX | 11,070 | 3,039 | 0.275 |
| Columbia | SC | 21,390 | 5,655 | 0.264 |
| Chester | PA | 8,955 | 2,358 | 0.263 |
| Fort Myers | FL | 11,480 | 2,993 | 0.261 |
| Phenix City | AL | 6,545 | 1,696 | 0.259 |
| St. Paul | MN | 60,140 | 15,483 | 0.257 |
| Hamilton | OH | 13,935 | 3,567 | 0.256 |
| Miami | FL | 97,820 | 24,849 | 0.254 |
| San Luis Obispo | CA | 9,290 | 2,349 | 0.253 |
| Marietta | GA | 10,925 | 2,724 | 0.249 |
| Hartford | CT | 33,670 | 8,369 | 0.249 |
| Bremerton | WA | 8,225 | 2,035 | 0.247 |
| Parkersburg | WV | 6,830 | 1,642 | 0.24 |
| Statesville | NC | 5,165 | 1,240 | 0.24 |
| Atlantic City | NJ | 10,550 | 2,521 | 0.239 |
| East St. Louis | IL | 8,605 | 2,047 | 0.238 |
| Paducah | KY | 6,200 | 1,472 | 0.237 |
| Canton | OH | 17,555 | 4,152 | 0.237 |
| Rome | GA | 6,310 | 1,488 | 0.236 |
| Macon | GA | 19,805 | 4,647 | 0.235 |
| York | PA | 11,165 | 2,591 | 0.232 |
| East Chicago | IN | 6,435 | 1,493 | 0.232 |
| New Haven | CT | 30,355 | 7,022 | 0.231 |
| Warren | OH | 9,670 | 2,235 | 0.231 |
| Charleston | SC | 19,520 | 4,478 | 0.229 |
| McKeesport | PA | 6,300 | 1,441 | 0.229 |
| Inkster | MI | 6,495 | 1,484 | 0.228 |
| Lewiston | ME | 7,455 | 1,675 | 0.225 |
| New Castle | PA | 5,510 | 1,230 | 0.223 |
| Alexandria | LA | 7,580 | 1,692 | 0.223 |
| Cincinnati | OH | 76,320 | 17,028 | 0.223 |
| Rochester | NY | 53,730 | 11,894 | 0.221 |
| Annapolis | MD | 5,825 | 1,288 | 0.221 |
| Mobile | AL | 33,460 | 7,395 | 0.221 |
Table of state results
See below in the table for the data of the top 50 best states for low income housing.
| State | Rank | Total # of low income Households |
Total # of Public Housing Units |
Ratio |
|---|---|---|---|---|
| West Virginia | 1 | 70,770 | 16,147 | 0.228 |
| Vermont | 2 | 21,905 | 4,770 | 0.218 |
| South Carolina | 3 | 147,414 | 31,586 | 0.214 |
| Louisiana | 4 | 334,292 | 60,050 | 0.18 |
| Maryland | 5 | 203,290 | 36,062 | 0.177 |
| Ohio | 6 | 746,660 | 130,826 | 0.175 |
| Alaska | 7 | 34,225 | 5,955 | 0.174 |
| Maine | 8 | 70,235 | 12,055 | 0.172 |
| Alabama | 9 | 362,809 | 60,995 | 0.168 |
| Massachusetts | 10 | 712,389 | 119,365 | 0.168 |
| Delaware | 11 | 27,480 | 4,261 | 0.155 |
| Georgia | 12 | 438,307 | 67,495 | 0.154 |
| Connecticut | 13 | 317,415 | 45,604 | 0.144 |
| Rhode Island | 14 | 114,615 | 16,385 | 0.143 |
| Oregon | 15 | 186,288 | 25,340 | 0.136 |
| Tennessee | 16 | 518,940 | 70,017 | 0.135 |
| New Jersey | 17 | 464,610 | 61,759 | 0.133 |
| Florida | 18 | 909,445 | 118,938 | 0.131 |
| Kentucky | 19 | 343,283 | 44,806 | 0.131 |
| Virginia | 20 | 361,715 | 47,434 | 0.131 |
| Illinois | 21 | 805,055 | 104,755 | 0.13 |
| Hawaii | 22 | 69,085 | 8,817 | 0.128 |
| Oklahoma | 23 | 270,775 | 34,790 | 0.128 |
| Washington | 24 | 337,870 | 43,187 | 0.128 |
| New Hampshire | 25 | 82,155 | 10,463 | 0.127 |
| Arkansas | 26 | 216,310 | 26,728 | 0.124 |
| Pennsylvania | 27 | 648,225 | 79,762 | 0.123 |
| Minnesota | 28 | 357,461 | 42,873 | 0.12 |
| North Carolina | 29 | 630,223 | 75,558 | 0.12 |
| Wyoming | 30 | 28,005 | 3,319 | 0.119 |
| New York | 31 | 3,827,499 | 450,323 | 0.118 |
| Nevada | 32 | 46,300 | 5,172 | 0.112 |
| Indiana | 33 | 490,810 | 53,012 | 0.108 |
| Idaho | 34 | 63,450 | 6,375 | 0.1 |
| Missouri | 35 | 404,413 | 40,090 | 0.099 |
| South Dakota | 36 | 61,502 | 5,575 | 0.091 |
| Mississippi | 37 | 134,235 | 11,924 | 0.089 |
| Iowa | 38 | 227,828 | 20,161 | 0.088 |
| Nebraska | 39 | 202,800 | 17,285 | 0.085 |
| New Mexico | 40 | 144,740 | 12,180 | 0.084 |
| Texas | 41 | 2,224,706 | 184,944 | 0.083 |
| California | 42 | 2,149,670 | 172,726 | 0.08 |
| North Dakota | 43 | 59,390 | 4,620 | 0.078 |
| Michigan | 44 | 625,106 | 48,357 | 0.077 |
| Kansas | 45 | 232,663 | 18,000 | 0.077 |
| Wisconsin | 46 | 434,755 | 31,494 | 0.072 |
| Montana | 47 | 59,530 | 4,122 | 0.069 |
| Utah | 48 | 118,430 | 7,026 | 0.059 |
| Colorado | 49 | 471,903 | 24,078 | 0.051 |
| Arizona | 50 | 528,260 | 23,786 | 0.045 |